
 GRE课程
GRE课程


GRE机经题库
>
>
图表题
>
NO.1700
中等
00:00
本题平均耗时:1分28秒
|
正确率:41%
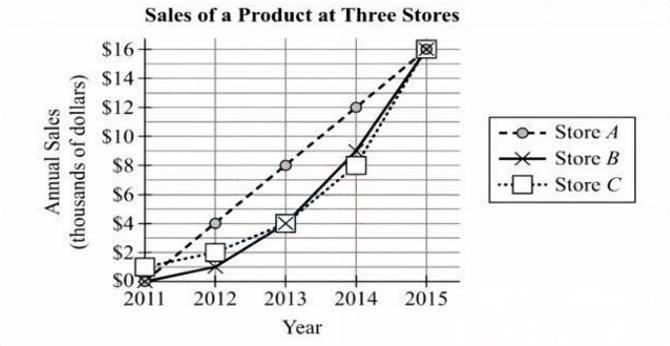
The graph above shows the annual sales, in thousands of dollars, for a certain product sold at three different stores for the years 2011 to 2015. Of the following sales, which had the greatest percent increase?
Sales at Store A from 2012 to 2013
Sales at Store A from 2014 to 2015
Sales at Store B from 2012 to 2013
Sales at Store B from 2014 to 2015
Sales at Store C from 2014 to 2015
Select one answer choice.
收藏此题

做题笔记

题目讨论